
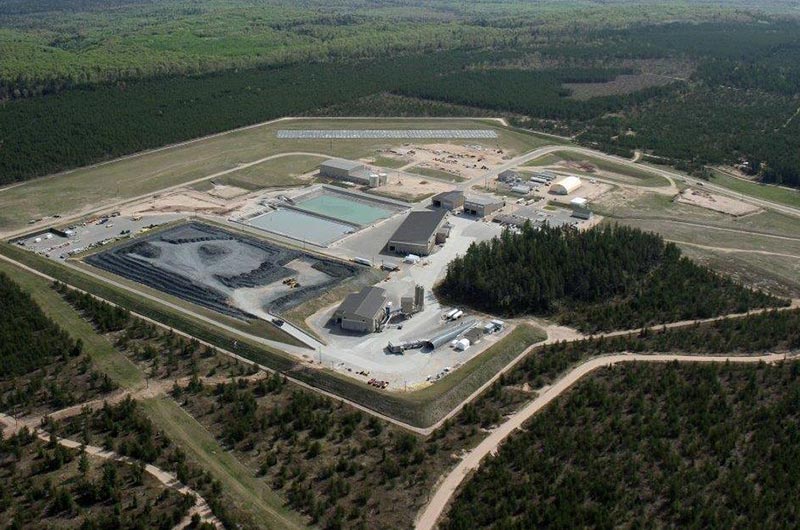
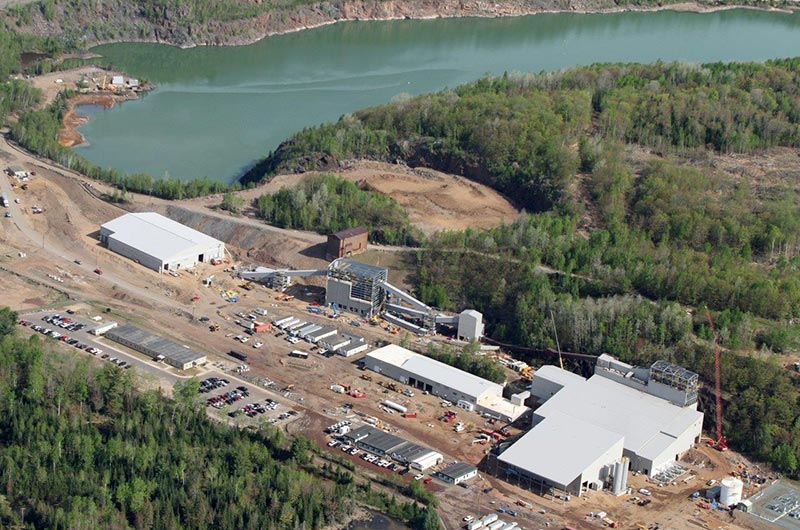
MONITORING RESULTS
CEMP Conducts Two Types of Environmental Monitoring:
- Verification Monitoring
CEMP conducts monitoring to verify the monitoring done by Eagle Mine as required by state mining permits. CEMP takes duplicate samples that are sent to a separate EPA-approved laboratory to verify results. - Additional Monitoring
This is monitoring done by CEMP over and above the monitoring that Eagle Mine does under its permits. CEMP will undertake additional monitoring if it believes it is needed to build a more complete picture of Eagle Mine’s operations.
The Report Card Rating System Explained:
CEMP assesses risk to the environment and human health by comparing monitoring results to State of Michigan Specified Permit Limits, EPA National regulations and recommendations, site specific benchmark (historic) values and other State, Federal and International Standards where appropriate. See Monitoring Categories below for specific standards used to assess risk by monitoring type. In addition, CEMP uses the following colored dot system to quickly classify potential risk from Eagle Mine’s operations at the Mine and the Humboldt Mill:
 |
In Compliance With State Permits: Indicates no known threat to the environment or human health. |
 |
In Compliance / Tracking Anomaly: Indicates an area that is being monitored but currently poses no known threat to the environment or human health. |
 |
Permit Exceedance: Indicates potential harm to the environment or human health. |
 |
Permit Exceedance / Tracking Anomaly: Indicates an area that is being monitored and poses potential harm to the environment or human health. |
DEFINITION: ANOMALY; Indicates a change in monitoring results; an increase or decrease in a given parameter. An anomaly is a deviation from historic or benchmark monitoring values. An anomaly does not necessarily indicate a threat to the environment or human health; additional monitoring (tracking) is required to make such a determination.
View Latest Monitoring Results
Latest Monitoring Period: See scorecard and reports below
Monitoring Scorecard & Reports
Includes All Prior Monitoring Periods
- 2025: q2
| Category | ||
|---|---|---|
| Facilities Monitoring
Monitors potential impacts from water that has come into contact with or is used in mining activities including wastewater treatment plant discharge. Data are compared to State of Michigan permit limits, site specific benchmark (historic values), and EPA drinking water standards where applicable. |
||
| Groundwater Quality
Monitors potential impacts to groundwater as a result of mining activities. Data are compared to State of Michigan Permit Limits, site specific benchmark (historic values) and EPA drinking water standards where applicable. |
||
| Surface Water Quality
Monitors potential impacts to nearby streams as a result of mining activities. Data are compared to State of Michigan Permit Limits, site specific benchmark (historic values) and State and EPA surface water quality standards for aquatic life. |
Additional Monitoring Reports
Air Quality Monitoring
Monitors potential impacts to air quality from mining activities. Air quality data (particulate matter) are compared to U.S. EPA National Ambient Air Quality Standards and Michigan Air Toxic Screening Levels. View online weather data (air quality particulate data coming soon).
View Latest Reports
Traditional/Edible Plants
Monitors potential impacts to edible berries and plants including species of high cultural value to the community. Includes collection and laboratory analysis of berries, leaves, and roots. Data are compared to guidelines and daily intake recommendations including the US Environmental Protection Agency’s Oral Tolerable Intake Values and the Food and Drug Administration’s recommended Daily Values.
View Latest Reports
Salmon Trout Headwaters “Seeps” Monitoring
Monitors potential impacts to the headwaters of the Salmon Trout River. The headwaters begin as “seeps” or natural springs at locations where groundwater daylights and becomes surface water. Data are compared to Michigan Surface Water Quality Standards and monitored for short-term and long-term changes in water chemistry.
View Latest Reports
Transportation Route Monitoring
Monitors baseline environmental conditions of surface water quality and air quality along the designated ore transport route. Data are used to establish existing conditions prior to mining activities. Data are compared to Michigan Surface Water Quality Standards and U.S. EPA National Ambient Air Quality Standards.
View Latest Reports
Exploration Site Monitoring
Monitors baseline environmental conditions (water quality, air quality, plants, fish and wildlife) at exploration sites. Data are used to establish existing conditions prior to exploration drilling and/or potential mineral extraction. Where applicable, data are compared to state and federal standards.
View Latest Reports
Noise and Vibration
Eagle Mine Noise and Vibration Studies.
View Latest Reports
Wildlife and Vegetation
Eagle Mine Wildlife Species and Vegetation Assessments.
View Latest Reports
Fisheries/Aquatic
Eagle Mine Aquatic Survey Reports.
View Latest Reports
Snow Sampling
Eagle Mine Snow Sampling Procedures and Results.
View Latest Reports
Mine Vent Air Raise (Stack Test)
Eagle Mine Permit Required Air Vent/Stack Air Quality Test.
View Latest Reports
Carbon Footprint
Lundin Sustainability report.
View Latest Reports